How to Access the Analytics Panel
- Open the project you want to view.
- In the top-right corner of the builder page, find the Analytics button.
- Click it to open the Analytics panel.
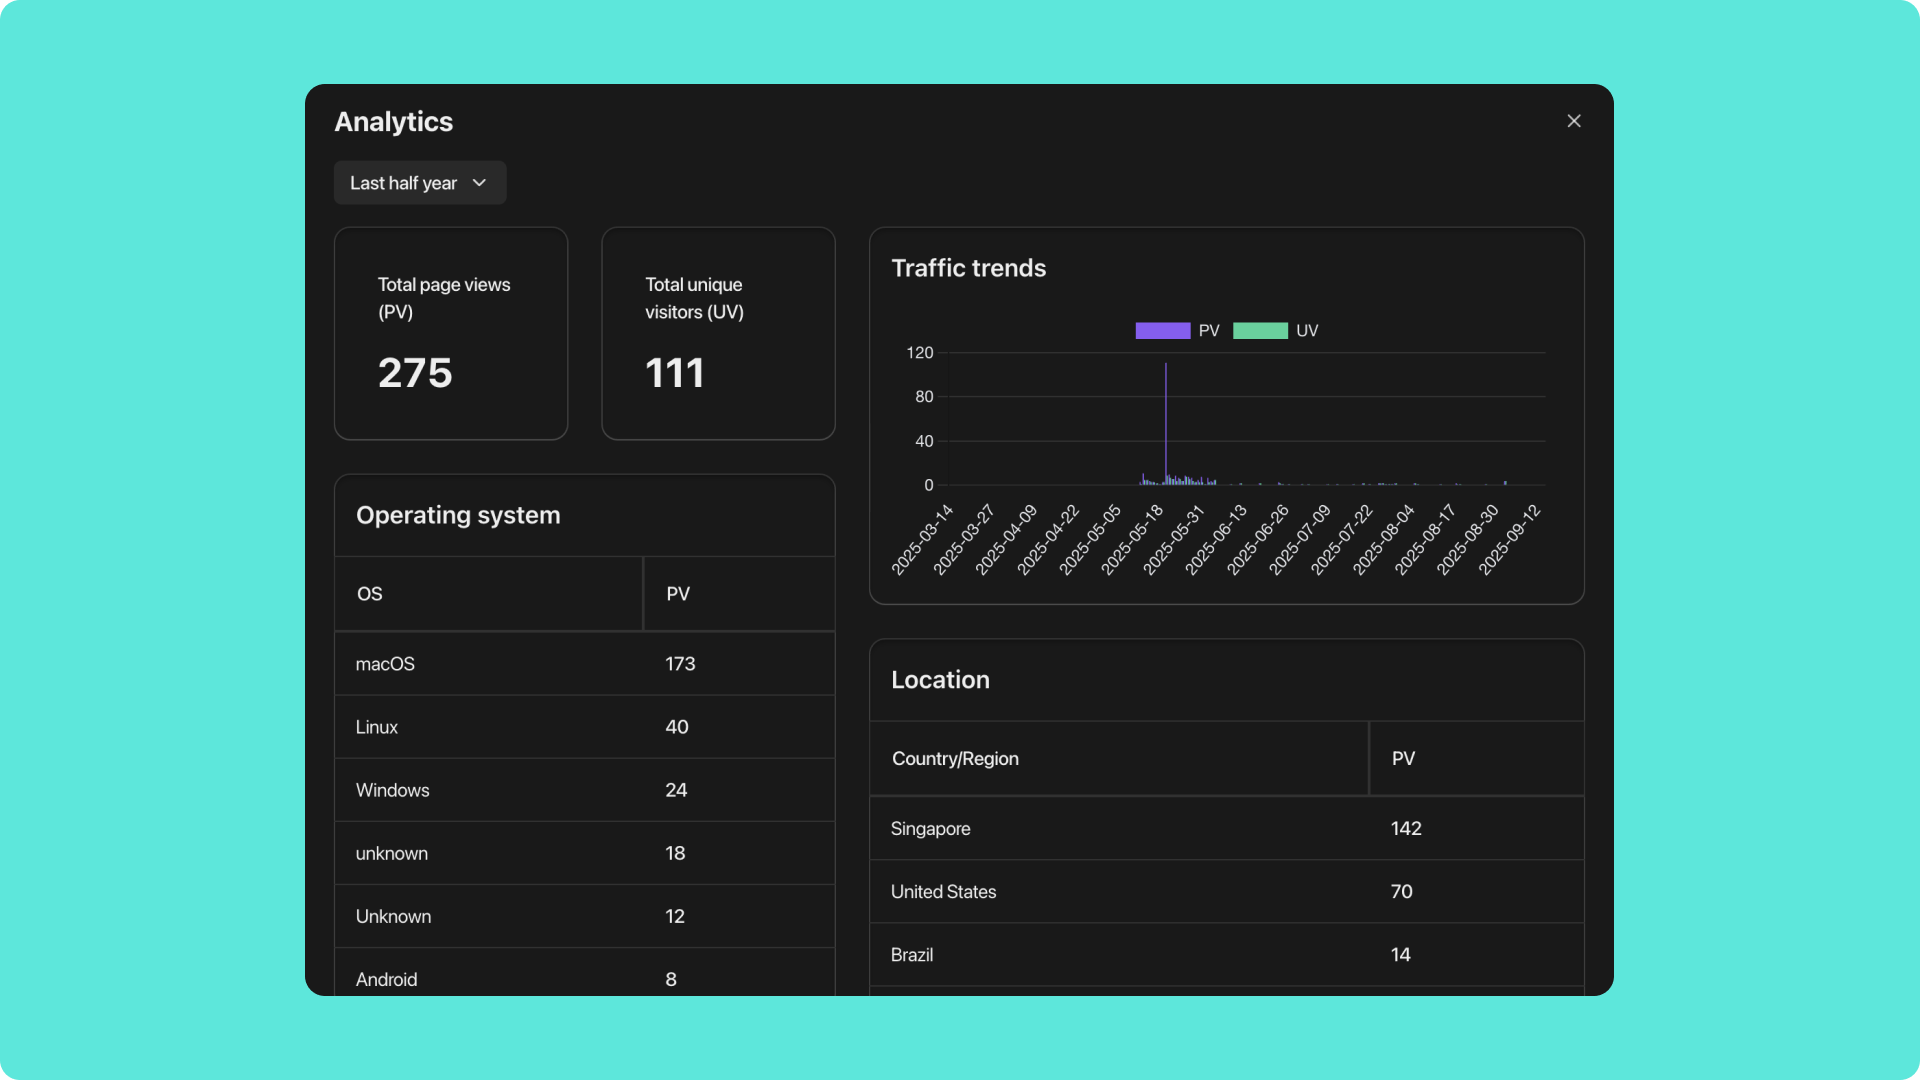
What Metrics Can You View?
In the Analytics panel, you can track the following key data:- Page Views Counts how many times users have visited your pages, helping you identify which pages attract the most attention.
- Unique Visitors Tracks the number of distinct users visiting your application, measuring actual reach.
- Traffic Trends Shows changes over time, helping you identify peaks, drops, and overall growth patterns.
- User Demographics Includes basic information such as location and device type, helping you recognize your main user groups.
Why Is the Analytics Panel Important?
- Validate Product Assumptions By seeing whether users actually visit and stay on the pages you designed, you can evaluate if features or content meet expectations.
- Identify Optimization Opportunities If certain pages have low traffic or if users drop off at specific steps, it may indicate the need for content or interaction adjustments.
- Measure Marketing Effectiveness After running campaigns or traffic experiments, Analytics data clearly shows whether they brought in new traffic and conversions.
- Support Iteration Decisions Instead of redesigning by intuition, use real data to guide design and feature updates.
Best Practices
- Check Data Regularly: Make the Analytics panel part of your routine building process and monitor changes continuously.
- Combine with Version History: Compare Analytics data with version updates to analyze which changes had positive effects.
- Focus on Trends, Not Single Points: Avoid overinterpreting daily fluctuations; focus on overall patterns.
- Data-Driven Optimization: Use Analytics insights to decide whether to refine copy, adjust layout, or add new features.